INTRODUCTION
THE FOREIGN-BORN POPULATION BY WORLD REGION OF BIRTH AND BY COUNTRY OF BIRTH,
FOR THE UNITED STATES AND STATES: 1850 TO 2020 (last revised, May 18, 2024)
Data on country of birth for the foreign-born population of the United States were collected in every decennial census from 1850 to 2000, and subsequently, these data have been collected in the American Community Survey (ACS). The purpose of this website is to present data on the total population by nativity (native and foreign born) and on the foreign-born population by world region of birth and by country of birth for the United States and individual states (and territories preceding statehood) from 1850 to 2020. Data shown for 2010 and 2020 are five-year average data for 2008-2012 and 2018-2022, respectively, from the ACS. These data are of interest both because of the importance of immigration in American history and because there have been major differences among the states in levels and trends in both the numbers and proportions of foreign-born. In addition, there have been major differences among the states in the sources of their foreign-born populations, as defined both by world region of birth and by individual countries of birth.
The data presented here may be viewed as an update and expansion of data presented in Historical Census Statistics on the Foreign-Born Population of the United States: 1850 to 2000 (U.S. Census Bureau, Population Division, Working Paper No. 81, February 2006). More specifically, the data presented on this website update data presented in Tables 1-4 in Working Paper No. 81 and expand coverage for the United States to include data for individual states. It is recommended that users of data presented on this website refer to the report cited for a general discussion of decennial census data on the foreign-born population, including information on sources of the data, definitions, and accuracy. For graphics showing historical data on the foreign-born population of the United States, see the American Demographic History Chartbook: 1790 to 2010, Chapters 11-13.
It should be stressed that all census data are subject to error, as discussed in the sources noted above. In the case of data on country of birth, there are several specific concerns for the data user. The first concern is the accuracy of reporting when a country has undergone boundary changes during the lifetime of the respondent, who may not have reported country of birth based on current boundaries.
The second concern is that due to boundary changes (e.g., in Europe and the Middle East after World War I), data for specific countries frequently are not directly comparable over time. To a lesser degree, data are not always comparable for higher levels of geography. For example, the Azores were included in Africa through 1970, but were then made part of Portugal and thus included in Europe.
The third concern is that data on country of birth do not always reflect ethnic or cultural heritage. For example, among the foreign-born White population from Austria in 1930, 55 percent reported German as their mother tongue (language spoken in the person’s home when he or she was a child), but an additional 9 languages were reported by at least 1 percent of the foreign-born population from Austria (Demographic Chartbook, Figure 13-7). Among the foreign-born White population from Russia in 1930, 65 percent reported Yiddish as their mother tongue, 23 percent reported Russian, and 9 percent reported German. In parts of the Midwest, German was the leading mother tongue of the foreign born from Russia.
The fourth concern is sampling error, starting when published data on country of birth of the foreign-born were first based on sample data (in part in 1950, and entirely since 1960). This is a particular concern in the case of data at the state level, where many of the published numbers for individual countries are very small and thus subject to high proportionate sampling error. This problem has increased with a decline in the sampling rate from 25 percent in 1960 to less than 10 percent for 2010 and 2020, using five-year average data from the ACS for 2008-2012 and 2018-2022, respectively.
It should be noted also that the U.S.-born children of immigrants are native (not foreign-born), and thus without continued immigration, at the national level the foreign-born population from a specific country can only decline over time due to attrition (i.e., death). Whether the foreign-born population from a specific country increases or decreases over a specific time period (apart from sampling error and other errors in the data) depends on whether immigration exceeds the total of emigration and attrition during this time period. In the case of the foreign-born population at the state level, changes over time are influenced also by interstate migration among the foreign-born.
FIGURES & TABLES
This section provides a brief description of the figures and tables included on this website. The figures present graphically basic information about the foreign-born population and country of birth, while the tables provide more detailed data.
Figures 1 to 52. These 52 one-page graphics show selected data from the C and D tables for the United States, the 50 states, and the District of Columbia. The graphics include numbers in thousands and short abbreviations for country names. The corresponding C and D tables noted in the headnote for each figure provide more detail. Full detail on country of birth is provided in the A and B tables.
Table A. This table presents data on the foreign-born population of the United States by world region of birth and country of birth from 1850 to 2020. This four-page table attempts to make the data as comparable as possible over time and includes some notes about changes in the names of countries. As noted previously, the data user needs to be aware of issues about comparability over time of data on country of birth.
Tables B-1850 to B-2020. These 18 tables present data on the foreign-born population of the United States and states by world region of birth and country of birth at ten-year intervals from 1850 to 2020. These tables range in length from four to twelve pages.
Tables C-1 to C-52. These 52 one-page tables present time-series data up to 2020 on the population by nativity and on the foreign-born population by world region of birth for the United States, the 50 states, and the District of Columbia.
Tables D-1 to D-52. These 52 one-page tables present time-series data up to 2020 on the ten leading countries of birth of the foreign-born population for the United States, the 50 states, and the District of Columbia. The rankings in these tables for data for 1960 to 2020 are based on the point estimates of data collected on a sample basis and thus do not reflect sampling variability.
One limitation of these tables is that the published detail on country of birth, especially for non-European countries, was quite limited for censuses before 1960. Thus, a country may have been in the top ten countries of birth for a state, but data for that country were not published. For the most part, this does appear to be a serious problem, with one notable exception: missing data for Florida on the foreign-born from Cuba. Data on the foreign-born from Cuba were first published in the 1870 census, then again in the 1880 census, when Cuba was the leading country of birth of the foreign-born for Florida. For the 1890 census, no data were published separately for Cuba, which was included in the West Indies. Data showing Cuba were published for states for 1900 and 1910, but for 1920 and 1930, data on the foreign-born for Cuba were not published at the state level.
For use in Table D-11 for Florida, the foreign-born population from Cuba was estimated for 1890, 1920, and 1930 using published data for adjacent decennial census years. The procedure used linear interpolation to create preliminary estimates for Cuba and other West Indies. These preliminary estimates were then controlled pro-rata to published totals for the West Indies.
Tables E-All Countries and Table E-Afghanistan to Table E-Zimbabwe. These 141 one-page tables present time series data (from 1850 to 2020 or some part of this span) on the ten leading states of residence for the foreign-born population from all countries (i.e., the total foreign-born population) and for individual countries of birth. Data are shown for each country with at least one year in the 1850-2020 span in which there were 10,000 or more foreign-born from that country and for which the data were published at the state level. As noted earlier for the D tables, for 1960 to 2020, the rankings do not take account of sampling variability.
In addition to tables for countries, these tables include a Table E for Atlantic Islands, the reason being that this area was a prominent area of birth for some states (most particularly Massachusetts, Rhode Island, and California). It was not until the 1920 census that data were published separately for the Azores, when the Azores accounted for 77 percent (33,995 of 44,340) of the foreign-born population from the Atlantic Islands.
DATA ISSUES BY YEAR
This section provides a brief discussion of data issues in the 1850 to 2020 period, as reflected in the B tables. These tables use the country names as shown in the respective censuses (e.g., British America for 1850 to 1880 and Canada subsequently). Unfortunately, there are several cases where data on the foreign-born population by country of birth were published with more detail for the United States than for individual states. These cases are identified with an asterisk in Table A-1.
1850 and 1860. Data presented in Table B-1850 and Table B-1860 reflect data published in census reports for those censuses. For reasons that are not clear and with a methodology that was not stated, the numbers for the total foreign-born population (but not the numbers by country of birth) by state for 1850 and 1860 were revised slightly for publication in the 1870 census, and these revised totals for 1850 and 1860 were carried forward in historical tables in subsequent censuses and in Working Paper No. 81, Table 14. In some states, the revised totals for the foreign-born population were lower than the original totals for the foreign-born with country of birth specified. The two sets of numbers on the total foreign-born population by state in 1850 and 1860 can be compared in Table B-1850 and Table B-1860, respectively, to see the size of the changes.
1870 to 1900. These data are presented in Table B-1870, Table B-1880, Table B-1890, and Table B-1900. There do not appear to be any major data issues, although it is unfortunate that data for Cuba, which were shown starting in 1870, were not shown separately in 1890, when Cuba was combined with the rest of the West Indies in data shown for the United States and states.
1910. Data for Poland starting in 1860 and for Bohemia starting in 1870 were shown separately, even though they were not independent countries. In 1910 census reports, persons born in Poland were distributed primarily to Austria, Germany, and Russia, based on their reported mother tongues. And persons born in Bohemia were included with Austria. The 1920 census of course reflected changes to the map of Europe after World War I, including the creation of the countries of Poland and Czechoslovakia. Table B-1910 includes estimates for Poland in 1910, as published in 1920 census reports, with corresponding estimates for Austria, Germany, and Russia in 1910. In addition, Table B-1910 includes estimates for Bohemia in 1910, with corresponding changes to the estimates for Austria. The result is a reasonably consistent set of numbers for Poland for 1900 to 1920 and a reasonably consistent set of numbers for Bohemia for 1900 and 1910. The new nation of Czechoslovakia was larger than Bohemia, and thus data for Bohemia in 1910 and Czechoslovakia in 1920 are not directly comparable.
1920 and 1930. These data are presented in Table B-1920 and Table B-1930. There do not appear to be any major data issues, apart from the previously mentioned lack of data for Cuba.
1940 and 1950. With the exception of 1850 and 1860, data on the foreign-born by country of birth have been collected for the total population (i.e., including all races). In 1850 and 1860, the data were collected and published for the free population. It is assumed here, as it was in 1870 census and subsequent census reports, that the entire slave population was native. This appears to introduce only a small amount of error, suggested by the fact that only 0.2 percent of the Black population in 1870 was foreign born.
For the censuses of 1870 through 1930, data on the foreign-born population by country of birth were published for the total population. For the census of 1940 and 1950, the focus in publications was on the White population. For 1940, the number of Nonwhite foreign born was published for states, with no country-of-birth detail, but with detail by race: Black, American Indian, Chinese, Japanese, and other races. For 1950, complete-count data on the Nonwhite foreign-born population with some world region and country of birth detail were published for states with 2,500 or more Nonwhite foreign-born populations. Sample data numbers were published for the total Nonwhite foreign-born population by state.
Published data on the foreign-born country of birth by White and Nonwhite for 1930 and 1960 have been used in combination with the published data described for 1940 and 1950 to develop estimates of the Nonwhite foreign-born population by country of birth for 1940 and 1950, with these estimates then being added to the published data for the White foreign-born population to produce estimates for the total foreign-born population by country of birth for the United States. A short paper on the development of these estimates, not published previously, is included as an appendix at the end of this write-up.
Developing estimates at the state level required an extension of procedures used at the national level. While the resulting estimates are subject to considerable relative error where small numbers were involved, the effect on estimates of the total foreign-born population by world region of birth are small because the Nonwhite foreign born accounted for only a small proportion of the total foreign-born population in these two years: 1.5 percent in 1940 and 2.5 percent in 1950.
Because the published country-of-birth detail for the White foreign-born in 1940 and 1950 was less than the detail published in previous censuses, it was necessary to combine data for Africa and Oceania for 1940 and 1950. Finally, the 1940 and 1950 estimates for individual countries of birth are limited almost entirely to the White foreign-born with a few exceptions, such as when data were published for Japan or China. Table B-1940 and Table B-1950 show in detail the available data and estimates developed here on the White and Nonwhite foreign-born population.
It would appear that a good alternative to developing estimates for unpublished data for 1940 and 1950 would be to use the IPUMS (Integrated Public Use Microdata Series) 100-percent files for the 1940 census and for the 1950 census. However, it turns out that there are major problems with using the IPUMS files. There are some substantial differences between published numbers and IPUMS numbers. For example, the published number of Nonwhite foreign born in the 1940 census is 175,758 compared with 215,017 (22 percent larger) in the IPUMS file. There are several countries for which number of White foreign born differs substantially between the published number and the IPUMS number, perhaps reflecting editing procedures used in preparing the published data. One general problem with the IPUMS data, based on my use of it for small-area historical research, is that it includes individuals on the enumerator schedules whom the enumerators crossed out for some reason (e.g., because the enumerator found out after listing the individuals that they should have been enumerated elsewhere based on their usual place of residence). These individuals were not included in published population totals, but they were included in the IPUMS files (perhaps to maximize information available for genealogical research). If there were no published data on the foreign-born population by country of birth for 1940, then the obvious choice would be to use the IPUMS data. But the fact that over 98 percent of the foreign-born population was classified by country of birth in published data for 1940 (all of the White foreign born) and for 1950 (all of the White foreign born and the majority of the Nonwhite foreign born) suggests that it is best to use the published data on the foreign born population by country of birth and to develop estimates for the less than 2 percent for whom data were not published in census reports.
1960 and 1970. These data are presented in Table B-1960 and Table B-1970. There do not appear to be any major data issues. As noted earlier, the 1960 census was the first in which all data on the nativity of the population and on the country of birth of the foreign-born population were collected on a sample basis. In order to provide a general indication of the size of the sampling error, some approximations are shown here for 1960 (when the sample size of 25 percent was higher than in subsequent years) of estimated numbers and (in parentheses) their standard errors: 50 (15), 100(20), 250 (30), 500 (40), 1,000 (50), 5,000 (110), 10,000 (160), 25,000 (250), and 50,000 (350).
Some approximations of standard errors of percentages (expressed in percentage points) for 1960 follow. These standard errors depend on both the base of the percentage and the estimated percentage itself.
Base of Percentage
| Estimated Percentage | 1,000 | 2,500 | 10,000 | 25,000 | 50,000 |
|---|---|---|---|---|---|
| 2 or 98 | 0.9 | 0.5 | 0.3 | 0.1 | 0.1 |
| 5 or 95 | 1.4 | 0.9 | 0.4 | 0.2 | 0.1 |
| 10 or 90 | 2.0 | 1.2 | 0.6 | 0.3 | 0.2 |
| 25 or 75 | 2.7 | 1.5 | 0.7 | 0.4 | 0.2 |
| 50 | 3.1 | 1.6 | 0.8 | 0.5 | 0.3 |
For more information on sampling error for data for 1960 and for subsequent years, see decennial census reports for 1960 to 2000 and the Census Bureau website for ACS data for 2008-2012.
1980 to 2000. These data are presented in Table B-1980, Table B-1990, and Table B-2000. Major data issues here are limited to 1980. See the headnote for Table B-1980 concerning some limitations of 1980 data. For these three census years, data on country of birth from printed reports were supplemented for the United States (but not for individual states) with more detailed data from the summary tape files (STFs) and subsequent summary files (SFs), as shown in working Paper No. 81, Table 3. As a result, Tables B-1980, B-1990, and B-2000 include country of birth data for significantly more countries for the United States than for individual states. The data on country of birth for the 1980 census in printed reports included significantly less detail than for the 1960 and 1970 censuses, despite the fact that the foreign-born population increased sharply between 1970 and 1980 and despite the fact that the pertinent table for states in 1980 (Chapter D, Table 195) left part of the page blank (three inches at the bottom). As a result, data for many countries, including some countries in Eastern Europe, Central America, and South America, were omitted in the 1980 printed reports.
2010
and 2020. These data, which are five-year average data from the ACS for 2008-2012 and 2018-2022, respectively, are presented in Table B-2010 and Table B-2020. There do not appear to be any major data issues. There was a major change in the presentation of sample data from the decennial census to presentation of ACS data. As shown above for census data for 1960, sampling variability was shown with tables of standard errors, where standard errors correspond to 69-percent confidence intervals around the point estimates.
For ACS data, a margin of error (MOE) is shown with each point estimate, and this MOE corresponds to a 90-percent confidence interval around the point estimate. These MOEs are shown as symmetrical (+/-) around the point estimate and have not been refined to adjust ranges around small point estimates that include negative values: e.g., 46 (+/- 52). Presenting MOEs with each point estimate is very helpful, but doubles the size of a statistical table, an alternative that would not have been practical with printed reports, but that is practical in the case of data “published” online on the Census Bureau’s website at data.census.gov., including all data released from the ACS.
Accessing data is much more complex online with ACS data than with decennial census data in printed reports, which include table finding guides as well as tables of contents. For example, to access estimates shown in Table B-2010, and their MOEs: (1) search on data.census.gov, (2) select Advanced Search, (3)under Geography, select Nation (United States) and then select State (All states), (4) under Surveys, select American Community Survey and then select 5-year estimates, (5) select years and then select 2012, (6) in Search box, type B05006 (which is the ACS table number for data shown here in Table B-2010), (7) in lower right, select Search, (8) select the table number, (9) on the right, select More tools, (10) select Excel, (11) open the table in Excel (lower left), (12) in lower left, select Data. The user can now edit the table (in terms of spacing and content) and see it online or print out the desired output. It should be noted that this procedure for obtaining data is subject to change depending on changes to the data.census.gov. website.
As noted earlier, the sampling rate for ACS is much lower than for 1960 census sample data and lower than for all decennial censuses sample data through the 2000 census. However, as opposed to the generalized standard error tables published with decennial census sample data, the MOEs accompanying ACS sample data are calculated for each point estimate and thus reflect the degree of clustering among the characteristic (e.g., foreign born or country of birth) within the geographic area (e.g., the state).
The following text table shows selected estimates and their MOE’s for South Carolina, using 5-year ACS data for 2018-2022 in ACS Table B05006. South Carolina was chosen because it had the median number for foreign born (270,170) among the 51 subdivisions of the United States (the 50 states and the District of Columbia). The examples shown from among total foreign born and the foreign born from various countries or aggregates of countries, such as continents) represent cases where the estimated numbers of foreign born are closest to 250,000, 100,000, 50,000, 25,000, 10,000, 5,000, 2,500, 1,000, 500, 250, 100, and 50. The table shows the estimates of the foreign born, their MOEs (90-percent confidence intervals), and the MOEs as percentages of their underlying estimates.
| Estimate | MOE (+/-) | MOE as a percentage of the estimate |
|---|---|---|
| 270,170 | 5,110 | 1.9 |
| 89,397 | 2,841 | 3.2 |
| 46,544 | 2,502 | 5.4 |
| 23,372 | 1,600 | 6.8 |
| 9,982 | 885 | 8.9 |
| 5,117 | 736 | 14.4 |
| 2,502 | 767 | 30.7 |
| 971 | 341 | 35.1 |
| 505 | 234 | 46.3 |
| 253 | 144 | 56.9 |
| 92 | 54 | 58.7 |
| 50 | 41 | 82.0 |
The “un-smooth” pattern of increasing percentages in the third column of this table illustrate the effect of various degrees of clustering, as described earlier. The relatively high percentages corresponding to estimates of 2,500 and under highlight the relative uncertainty in these estimates and provide evidence of the high degree of uncertainty pertaining the rankings of the top ten countries of birth for states when the underlying numerical estimates are small.
CONCLUDING COMMENTS
This website may be viewed as a work in progress. More detail on country of birth of the foreign-born population by state may be obtained for the 1960 to 2000 period using summary tape files (STFs) and their subsequent summary files (SFs), especially for 1980, as discussed earlier.
Comments and suggestions, including corrections of any data errors or typos, are welcome.
APPENDIX (text and Table 1)
ESTIMATES OF THE FOREIGN-BORN POPULATION BY COUNTRY OF BIRTH
FOR THE UNITED STATES: 1940 AND 1950
Introduction.
Data on country of birth for the foreign-born population of the United States were collected in every decennial census of population from 1850 to 2000. These data were published in census publications through 1990 and are available on the Census Bureau website (www.census.gov) for 2000. For 1850 through 1930, these data were published for the total population (i.e., all races combined), except that data for 1850 and 1860 exclude the slave population. For 1910 through 1930, data on country of birth of the foreign-born population were published also for the White population as part of tabulations on country of origin of the White population of foreign stock (the foreign-born population and the native population with one or both parents foreign born). For 1940, the publication of data on the foreign-born population by country of birth was limited entirely to the White population; and for 1950, the published data were focused on the White population, with limited data published separately for the Nonwhite foreign-born population by country of birth. For 1960, the corresponding data were published for the total, White, and Nonwhite populations; and for 1970 through 2000, the corresponding data were published for the total population. Thus, for the 1850 to 2000 period, 1940 and 1950 are the only census years for which data on country of birth for the total foreign-born population were not published as part of the decennial census of population. (Data on country of birth of the foreign-born population for 2010 are available from the American Community Survey (ACS); see the Census Bureau website: www.census.gov .)
Data on country of birth of the Nonwhite foreign-born population for 1940 and 1950 thus are needed to obtain corresponding data for the total foreign-born population. For two reasons, it turns out that this can be accomplished by estimation with very little error. First, the Nonwhite foreign-born population was very small in comparison with the total foreign-born population in these years: 175,758 out of 11,594,896 (1.5 percent) in 1940, and 259,740 out of 10,418,594 (2.5 percent) in 1950. Second, data published on the foreign-born population by race for 1940 and for the Nonwhite population with limited country of birth detail for 1950 in combination with detailed country of birth data for the Nonwhite foreign-born population in 1930 and 1960 greatly facilitate estimating the Nonwhite foreign-born population by country of birth for 1940 and 1950.
The purpose of this paper is to develop estimates of the Nonwhite foreign-born population by detailed country for birth for 1940 and 1950 and to combine these estimates with published data for the White foreign-born population to produce estimates for the total foreign-born population by country of birth, thus filling a gap in the historical time series for 1850 to 2000. It should be stressed that the primary purpose of this paper is to develop estimates of the total foreign-born population by country of birth and that for most countries shown (including all European countries), a large proportionate error in the estimate of the Nonwhite foreign-born population would have a negligible effect on the proportionate error in the estimate of the total foreign-born population.
In order to make these estimates comparable with a previously published time series on country of birth of the foreign-born population, the format and geographic detail used are the same as in Historical Census Statistics on the Foreign-Born Population of the United States: 1850 to 2000, Table 4, which includes data for 1850 to 1930 and for 1960 to 2000 (U.S. Census Bureau, 2006.). All other references for this paper are publications of the U.S. Bureau of the Census (before the name change to U.S. Census Bureau). These reports are included in the reference section.
The limitations of census data on the foreign-born population by country of birth are discussed in the references, including errors in data collection, processing, and tabulation. In this regard, one error in data collection is of particular concern. In 1950, the census schedule, unlike schedules for 1930 and 1940, did not include an instruction to distinguish between Ireland and Northern Ireland, with the result that the number for Northern Ireland was greatly understated. The data here have been adjusted to correct for this error, as explained in the notes for Table A. Data on country of birth are generally based on political boundaries as of the census; however, changes in country boundaries, such as those after World War I and World War II, affect the accuracy of reporting as well as the comparability of data over time.
The published data on country of birth for 1930 and 1940 are complete-count data, and the data for 1960 are based on a 25-percent sample. Data for 1950 are a mixture, with the limited data published for the Nonwhite population being complete-count data, and data published for the White population being a combination of complete-count data for countries for which the number was relatively large (including all with a number of 40,000 or more) and 20-percent sample data for other countries.
Table 1 shows published data and estimates of the foreign-born population by country of birth for the total, White, and Nonwhite populations from 1930 to 1960. In Table 1, the numbers that are entirely modeled estimates for 1940 and 1950 are marked with an asterisk. If a number for a higher level of geography than a country is based partly on a modeled estimate, it is not marked; however, one can look at the component geography to see the contribution of modeled estimates.
Estimates for 1940.
The pertinent data published for the foreign-born Nonwhite population for 1940 are limited to detail by race (with no country of birth detail). The total of 175,758 includes 83,941 Black, 4,491 American Indian, 37,242 Chinese, 47,305 Japanese, and 2,779 other races (1943a, Table 4). The foreign-born Nonwhite population in 1930 (with Mexican combined with the White population for consistency with all other censuses) was 220,744, including 98,620 Black, 3,552 American Indian, 44,086 Chinese, 70,477 Japanese, and 4,009 other races (1933, Table 2, p. 231). The sizable declines (all 15 percent or more) from 1930 to 1940 in the total and in each of the major categories (Black, Chinese, and Japanese) suggests that there was little immigration during the 1930s among these groups, which in turn suggests that the proportionate distribution of the foreign-born population by region and/or country of birth for each of these groups did not change much between 1930 and 1940. In addition, the 1930 foreign-born populations of these three groups were highly concentrated by country or region of birth: 76 percent of Blacks were born in the Caribbean, over 99 percent of Chinese were born in China, and over 99 percent of Japanese were born in Japan. The geographic detail published for the Nonwhite foreign-born population by race in 1930 included about 20 geographic categories (countries and regions) with an emphasis on those with sizable foreign-born Nonwhite populations. For example, no geographic detail was shown within Europe.
For each of the Nonwhite races, the distribution of the foreign-born population by country of birth in 1930 was adjusted pro-rata to the corresponding 1940 totals, and these results by race were then added to produce estimates of the Nonwhite foreign-born population for each of the geographic categories shown for 1930. Within each of the geographic categories above the country level (e.g., Europe, Africa, and Other Asia), the distribution of the Nonwhite foreign-born population by country in 1930 was adjusted pro-rata to the newly developed estimates for 1940 to produce estimates of the 1940 Nonwhite foreign-born population by country in 1940.
The foreign-born White population from Albania was included in Europe, n.e.c. in 1940 rather than being shown separately. It is assumed here that the percent change from 1930 to 1940 was the same for Albania and Europe, n.e.c.
Estimates for 1950.
Unlike the case for 1940, there are some data on country of birth for the foreign-born Nonwhite population for 1950. It is especially important to have these data because the number increased from 175,758 in 1940 to 259,740 in 1950, indicating a large net immigration during the 1940-1950 decade relative to the beginning number. As a result, it would have been much more tenuous to assume the same proportionate distribution by country of birth in 1950 as in 1940 for a region or country than it was to assume the same proportionate distribution in 1940 as in 1930.
The published data on country of birth of the Nonwhite foreign-born population for 1950 include about 20 countries and regions with an emphasis on those with sizable Nonwhite foreign-born populations. For example, no country detail is shown for Europe, but within Asia, data are shown for China, India, Japan, Korea, the Philippines, and Other Asia).
In addition, data from a special tabulation on the total foreign-born population by country of birth for 1950 were published for a large number of European countries, Mexico, and Canada in Historical Statistics of the United States (U.S. Bureau of the Census, 1975, pp. 117). (The source refers to unpublished data for 1950, but does not offer any more information.) For these countries, the Nonwhite foreign-born population can be obtained by subtraction: total minus White.
Given the data available for 1950, only a small proportion of Nonwhite foreign-born population in 1950 needed to be allocated for the individual countries shown in Table 1. Excluding the components of the United Kingdom and the French and non-French components of Canada, the number is less than one percent of the Nonwhite foreign-born population. It was assumed that the number of Nonwhite foreign-born from Canada (8,476, not reported by parts of Canada) included none from French Canada since this was the case in 1930. For most countries for which allocation was necessary to develop estimates of the Nonwhite foreign-born for 1950, the numbers for 1940 and 1960 were averaged (linear interpolation) and the results were then adjusted pro-rata to agree with available control totals for 1950. For Asian countries for which allocation was necessary (Palestine, Syria, and Turkey), the estimates for 1950 were based on a pro-rata adjustment of numbers for 1960 given the lack of geographic comparability with 1940 for Other Asia, when the Philippines was not classified as a foreign country.
Summary.
This paper presents estimates of the Nonwhite foreign-born population of the United States by country of birth for 1940 and 1950 to combine with published data for the White foreign-born population to produce estimates of the total foreign-born population by country of birth for 1940 and 1950. These estimates fill a gap in the historical time series from 1850 to 2000 based on published data from the decennial census of population.
References (all U.S Bureau of the Census, Washington, DC, U.S. Government Printing Office, except for the reference for U.S. Census Bureau (2006), which reflects a change in the name of the agency.
1933. 1930 Census of Population, Vol. II, General Report: Statistics by Subjects.
Chapter V, Table 2, p. 231 (foreign-born population by race by limited country of birth).
Chapter V, Table 4, p. 233 (foreign-born population by detailed country of birth).
Chapter VI, Table 4, p. 268 (foreign-born White population by detailed country of birth).
1943a. 1940 Census of Population, Vol. II, Part 1, Characteristics of the Population, U.S. Summary.
Table 4, p. 19 (foreign-born Nonwhite population by race).
Table 15, p. 43 (foreign-born White population by semi-detailed country of birth).
1943b. 1940 Census of Population, Characteristics of the Nonwhite Population by Race.
Table 1, p. 5 (foreign-born Nonwhite population by race).
1953. 1950 Census of Population, Vol. IV, Part 3, Chapter B, Nonwhite Population by Race.
Table 25, p. 82 (foreign-born Nonwhite population by race by limited country of birth).
1954. 1950 Census of Population, Vol. IV, Part 3, Chapter A, Nativity and Parentage.
Table 12, p. 71 (foreign-born White population by detailed country of birth).
1964. 1960 Census of Population, Vol. I, Part 1, Characteristics of the Population, U.S. Summary.
Table 162, p. 366 (foreign-born population by White and Nonwhite by detailed country of birth).
1975. Historical Statistics of the United States, Colonial Times to 1970, Bicentennial Edition, Part 1.
Chapter C, Series C 228-295, pp. 117-118 (1950 foreign-born population by country of birth, semi-detailed for total and detailed for White).
U.S. Census Bureau. 2006. Historical Census Statistics on the Foreign-Born Population
of the United States, Population Division Working Paper No. 81, by Campbell Gibson and Kay Jung.
(last revised, 26 Feb. 2022, FB website (7) paper on 1940 and 1950 COB estimates, Table 1, COB by White and NW, 1930 - 1960)
Table 1. FOREIGN-BORN POPULATION BY COUNTRY OF BIRTH BY WHITE AND NONWHITE: 1930 TO 1960
(This table shows the line numbers as shown in U.S. Census Bureau, 2006, Population Division Working Paper No. 81, Table 4, to facilitate comparison)
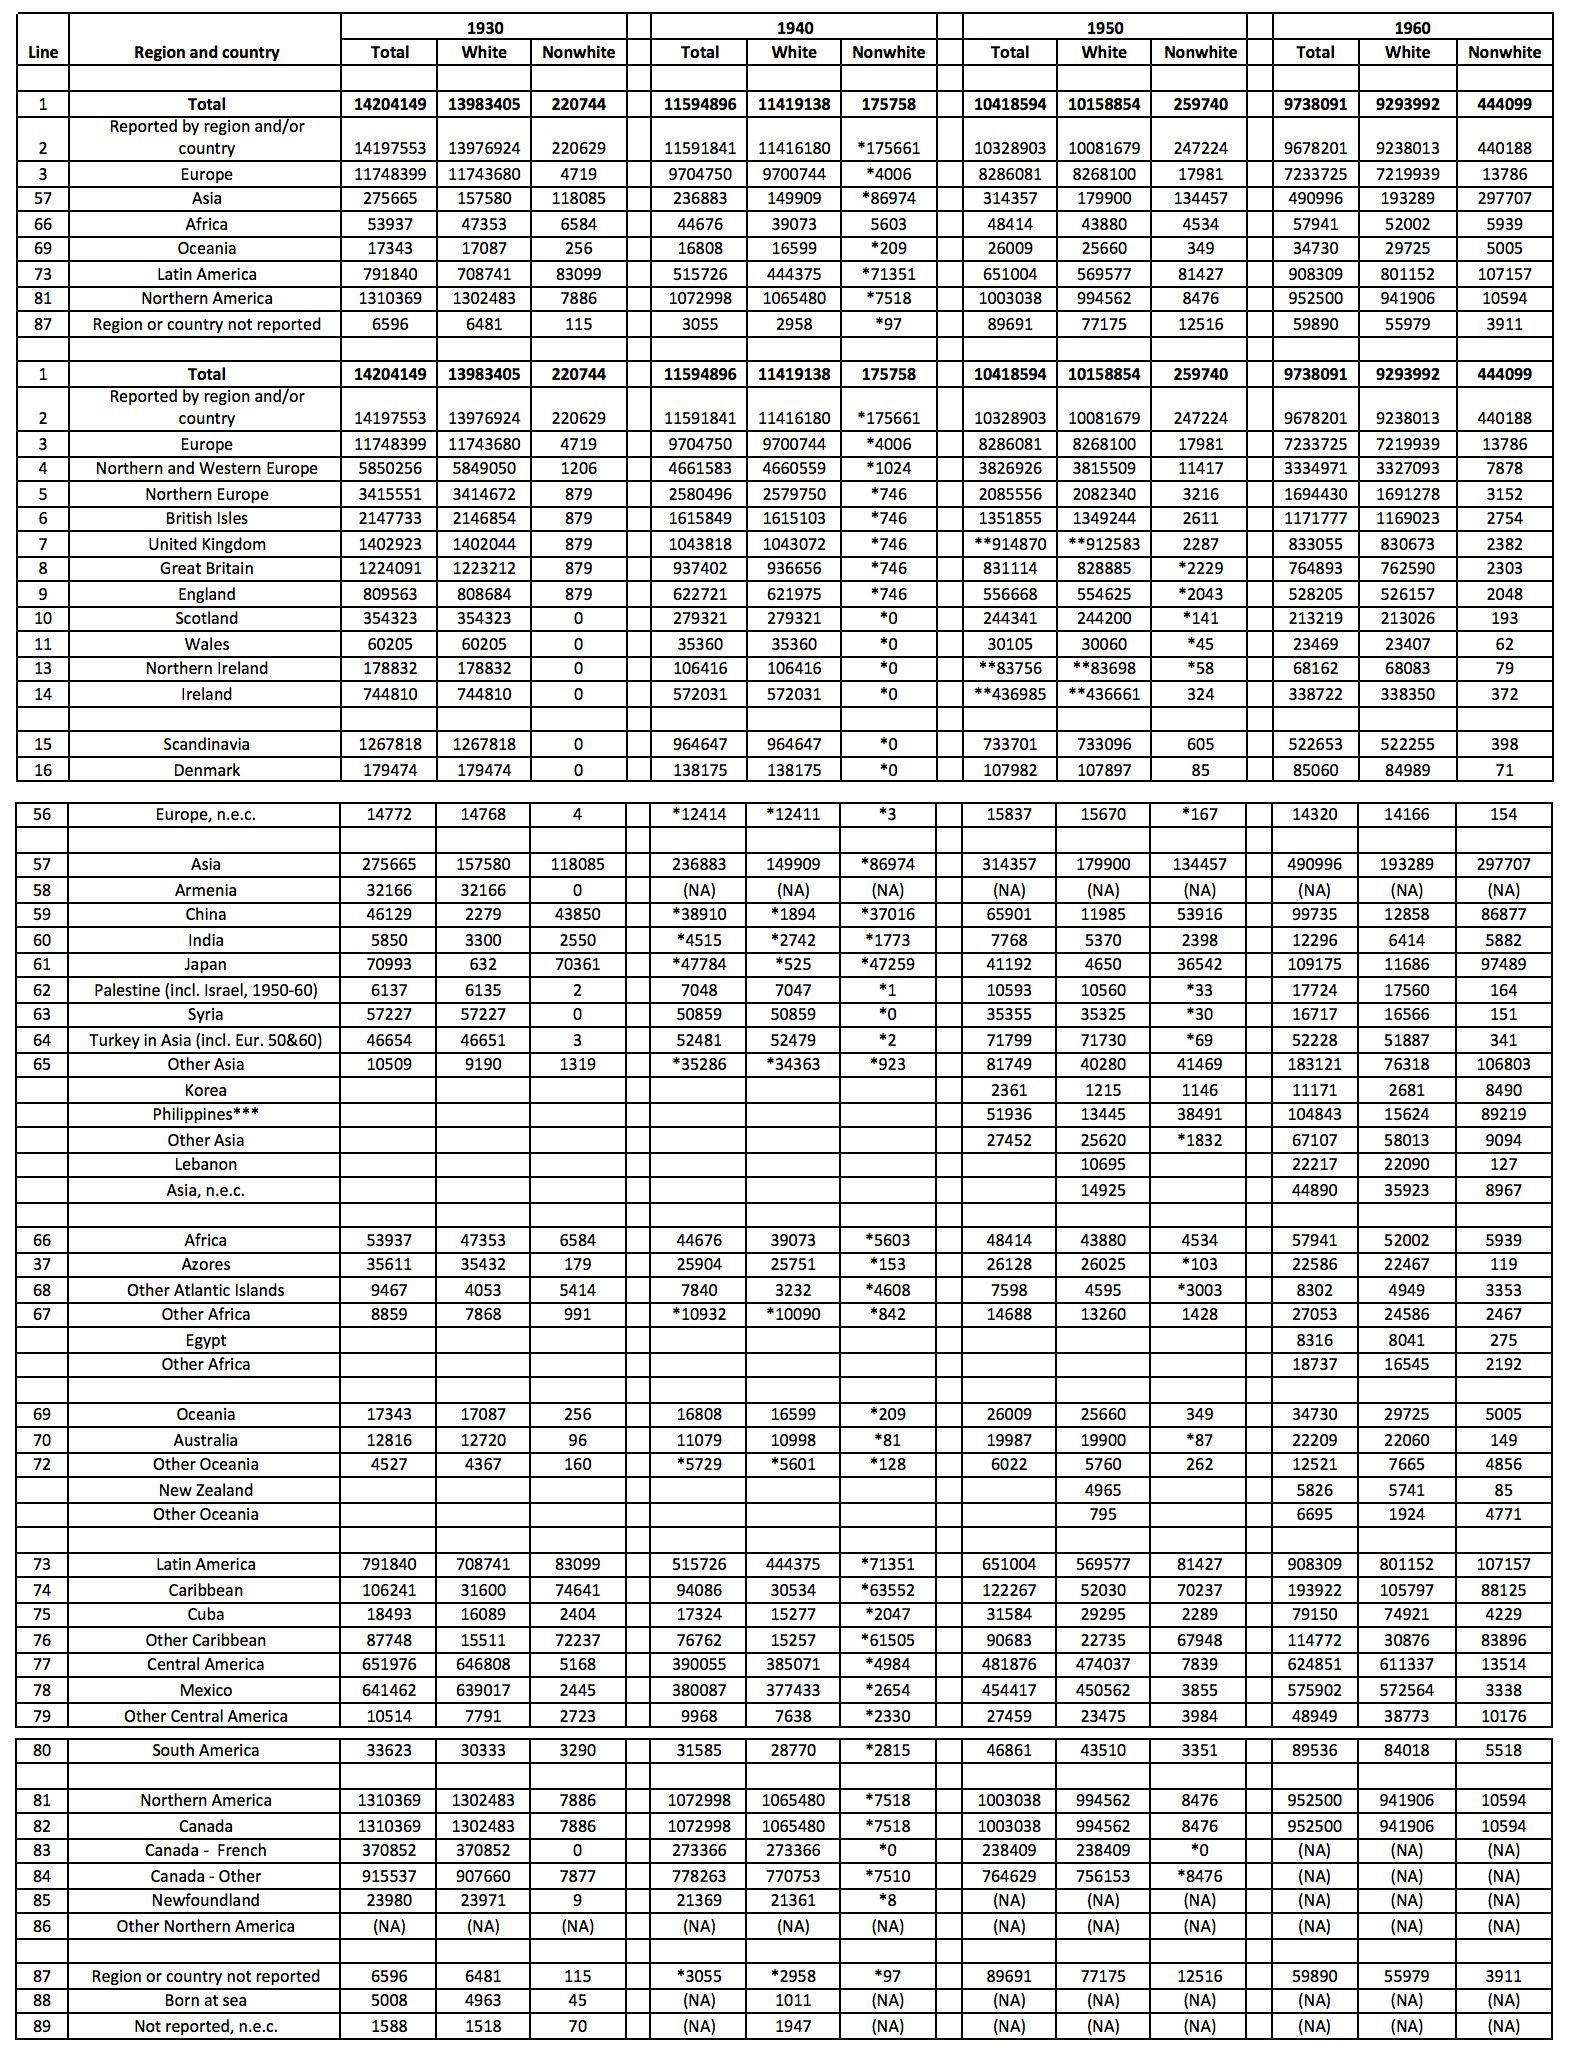
(NA) Not available. (n.e.c.) Not elsewhere classified. (X) Not applicable.
*Number is entirely an estimate based in part on a published number at a higher level of geography. If the numbers shown for White and Nonwhite are both estimates, then the number for Total is also shown as an estimate. See text.
**The foreign-born White population from Northern Ireland was greatly understated because the 1950 census questionnaire, unlike questionnaires for 1930 and 1940, did not include an instruction to distinguish between Ireland and Northern Ireland. The reported White foreign-born population from Northern Ireland was 106,416, in 1940, 15,398 in 1950, and 68,083 in 1960. The corresponding numbers for Ireland were 572,031, 504,961, and 338,350. The proportionate declines in the White foreign-born population from 1940 to 1960 were similar for Northern Ireland (36 percent) and Ireland (41 percent). The 1950 numbers were adjusted by averaging reported numbers for 1940 and 1960 and then controlling pro-rata to the reported number for 1950 for Northern Ireland and Ireland combined.
***The Philippines became independent in 1946 and was classified as a foreign country starting with the 1950 census.